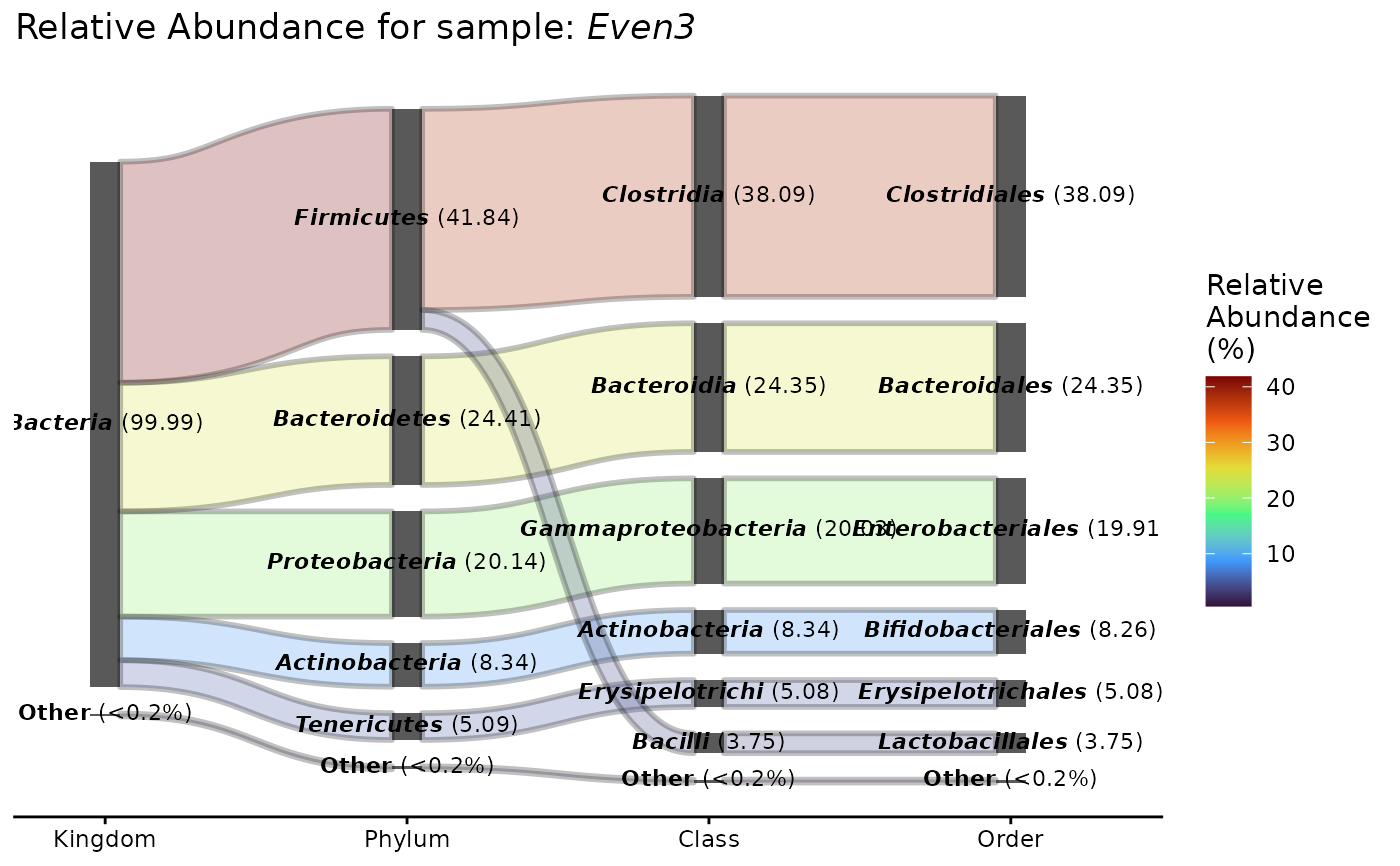
Visualizes the flow of taxa across hierarchical taxonomic ranks (e.g.,
Kingdom -> Phylum -> Class -> Order -> Family -> Genus -> Species) using a Sankey diagram.
If multiple samples are provided or samples = NULL (default), mean abundances
across samples are used. The number of displayed taxa is limited to ntaxa
to avoid visual clutter.
Usage
plot_taxa_sankey(
  me,
  tax_rank,
  samples = NULL,
  group_var = NULL,
  plot_title = NULL,
  rm_missing = FALSE,
  group_labels = NULL,
  min_abundance = 0,
  min_prevalence = 0,
  as_relative = TRUE,
  filter_by_group = FALSE,
  text_size = 3,
  ntaxa = 30,
  ...
)
Arguments
- me
A
microEDAorphyloseqobject containing OTU table, tax_table, and optionally sample_data.- tax_rank
Characterstring specifying the taxonomic rank to agglomerate at (e.g., "genus", "family").- samples
Optional
charactervector of sample names to include. IfNULL, all samples are used.- group_var
Optional name of a variable in
sample_data(me)to group samples. Used for filtering and labeling iffilter_by_group = TRUE.- plot_title
Optional
characterstring for the plot title. IfNULL, a default title is generated based on the number of samples.- rm_missing
Logical.IfTRUE, removes taxa with missing/unclassified entries at the specified rank. IfFALSE, fills missing values by propagating the last known ancestor, labeling them as "Unclassified Last_Known_Parent_Clade" (e.g., "Unclassified Enterobacteriaceae"). (Default:FALSE).- group_labels
Named character
vectormapping old group names to new labels (e.g.,c("Old" = "New")).- min_abundance
Numericvalue. Minimum abundance threshold for a feature to be retained. Must be non-negative. Features with abundance below this are considered absent.- min_prevalence
Numericvalue. Minimum prevalence required for retention. If value is < 1, interpreted as proportion of samples; otherwise, as absolute number of samples.features.- as_relative
Logical. IfTRUE, applies relative abundance transformation (TSS) to the input counts. IfFALSE, uses raw counts. (Default:TRUE).- filter_by_group
Logical. IfFALSE(default), filtering is applied globally across all samples even ifgroup_varis specified. This allows usinggroup_varfor stratification in plotting without affecting the filtering scope. IfTRUE, filtering is applied within each group defined bygroup_varandgroup_requirement. See filter_features for more details on filtering arguments.- text_size
Label size of taxa names (Default: 3).
- ntaxa
Number of top taxa to display before grouping into "Other" (Default: 30).
- ...
Additional arguments for fine-tuning. Can include:
abundance_criterion:Characterstring. Criterion to use for filtering:prevalence:Retain features present in at least
min_prevalencesamples (within group ifgroup_varis used) and with abundance >=min_abundancein those samples.mean:Also requires that the mean abundance across samples (or group) is >=
min_abundance.
Default:
"prevalence".group_requirement:Characterstring. Whengroup_varis specified, determines whether the filter criterion must be met in"any"group or"all"groups. Default:"any".keep_filtered: Whether to keep filtered out taxa as "Other" (Default:TRUE). Takes effect only formicroEDAobjects.ncp: Number of control points on the Bezier curve that forms the edge. Larger numbers will result in smoother curves, but cost more computational time. (Default: 100).slope: Slope parameter for the Bezier curves used to depict the edges.(Default: 0.5).
Examples
data(GlobalPatterns, package = "phyloseq")
plot_taxa_sankey(GlobalPatterns, tax_rank = "Order", samples = "Even3")
#> Warning: Both 'min_abundance' and 'min_prevalence' are 0. No filtering will be applied.
#> Warning: Conflicting taxonomy for 1 taxon at rank 'Order'. Inconsistent higher-level classification detected for:
#> Unclassified_Actinobacteria
#> Taxa below 0.2% relative abundance were merged into 'Other'.